Modelling Workflow
Overview
Once you are confident that your model provides a reasonably accurate representation of your network deterioration, you can proceed to evaluating budget scenarios with treatment allocation and optimisation done by Juno Cassandra.
We recommend you start by ensuring there are no thresholds in your Candidate Selection rule set that prevents required treatments from being placed. A commonly encountered problem is that your model does not apply enough treatments of a certain category no matter how much budget you allow for that treatment.
You should address these types of problems before you start analysing different budget scenarios, otherwise you will have to modify trigger thresholds at a later stage which will require you to re-do the analysis for all scenarios.
Figure 1 shows a proposed workflow for first ensuring that your model can trigger a reasonable percentage of each treatment category.

Inflated Budget Run
You start the process by first running an analysis with an inflated budget. We use the term inflated budget rather than unlimited budget because an virtually unlimited budget tends create problems of its own (such as triggering an unrealistic percentage of treatments in the first year and then almost nothing later on).
By inflated budget we mean a budget that is (a) clearly significantly greater than what is currently used or has been used in the past; and (b) likely to be sufficient to significantly improve network condition over a 20 to 30 year period.
You can design your inflated budget as if there were no funding constraints but also no money to waste on inneffective or unnecessary treatments.
Does Network Condition Improve?
After running the model with your inflated budget, you should check the Key Performance Indicators of your network. You should see a significant improvement in network condition.
If you do not see a significant improvement, or if you still see a deterioration in either (a) Surface Remaining Life; (b) Pavement Distress Index; or (c) Rut Depth, then there is some threshold or filter that is preventing the required treatments from being applied. The next step is to find and address these blocks.
What To Change?
The primary place to start for addressing the problem where not enough treatments are being triggered is in the lookup table set dealing with Candidate Selection.
In the Cassandra Default Road Network Model, the Candidate Selection thresholds are used to filter out segments for which a treatment is definitely not needed, thereby ensuring that the downstream optimisation algorithm does not have to do unneccessary work.
Although the default thresholds for Candidate Selection are already quite generous, you may want to tweak these thresholds to see if they have any influence on budget utilisation. See this page for details on which lookup set to modify.
In a MCDA model, a second place to look when addressing treatment issues is in the thresholds for Treatment Suitability Scores. In an MCDA model, the Treatment Suitability Score (TSS) plays a key role in the multi-criteria optimision algorithm.
If the TSS is below a certain threshold (specified in the model configuration), then that treatment will not be considered during optimisation. Thus, you can explore adjusting thresholds for the TSS and other thresholds related to the MCDA model to see whether these influence budget utilisation.
See this page for details on the parameters that influence the TSS specifically. See this page for details on thresholds that influence the triggering of treatments in an MCDA model.
Before you make changes to the thresholds that influence the TSS in your model, it is strongly recommended that you ensure you are sure how the MCDA model scores treatment suitability. See this page for a detailed discussion of this aspect.
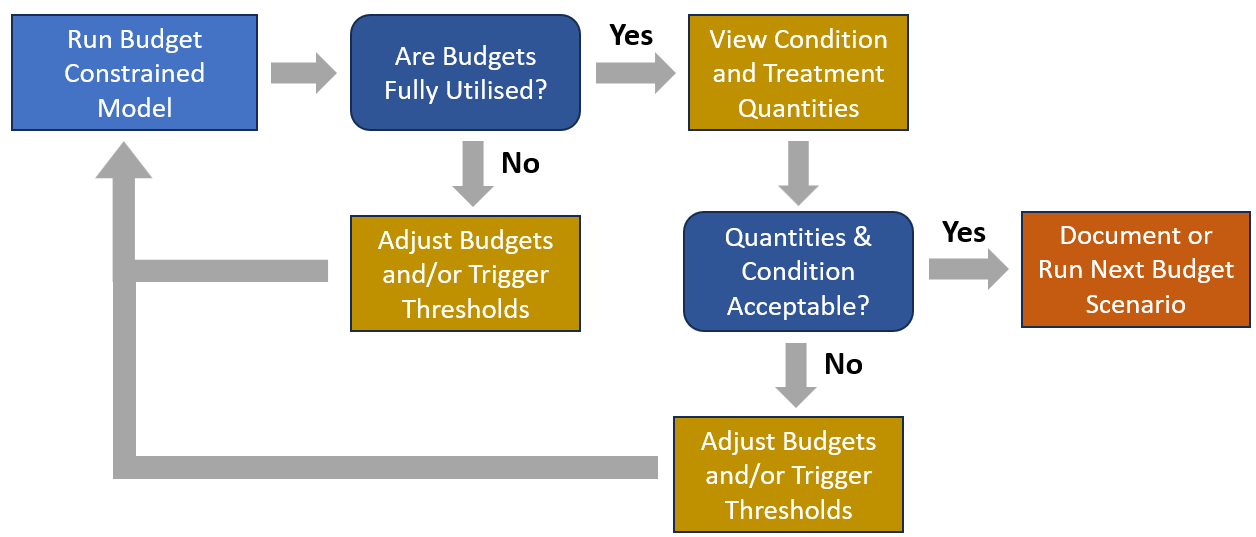
Constrained Budget Runs
If you finish the above stage, you should be confident that - given enough budget - your model will trigger and apply sufficient treatments to significantly improve network condition. You can now start to explore the more realistic scenarios cases of constrained budget scenarios. Figure 2 shows a suggested workflow for this stage of your modelling project:
Addressing Budget Under-Utilisation
Often you will want to explore different budget scenarios in which you compare the influence of an increased budget relative to the historic or current funding levels. Before you start exploring increased budget levels, you should check whether all of the available budgets are utilised at the current funding level. If you suspect that the current funding levels are high relative to the network needs, you should consider first creating a low budget scenario with which to test Budget Utilisation.
In Juno Cassandra Desktop, you can quickly view the levels of budget utilisation by going to the Post-Processing menu and selecting Budget Utilisation. This tool will show the percentage budget utilisation for each budget category. Unless you are exploring a virtual-unlimited budget scenario, you should see close to 100% budget scenario for most years.
You should not expect to see 100% utilisation across all years. Getting more than 99% budget utilisation in most years is sufficient. However, you do not want to see consistent budget utilisation of less than 90% in most years.
All networks have ebb and flow in their renewal requirements. If there is a large backlog, as there often is, you may get 100% budget utilisation for the first five to eight years, and then a bit of a ‘lull in the fighting’ when most of the urgent needs are met. This is normal. But a consistent pattern of less than 90% utilisation or less than 80% utilisation in most years requires attention.
If some or all budget categories are not fully utilised, there is no point in increasing the budget constraints - your model will not apply all of the available funding in either case. In such a situation, the first step is to explore the reason for the under utilisation.
A first step is to explore network condition - both structural (PDI) and surface-related (surface remaining life). If these indicators deteriorate aggressively over time when some budgets are not fully utilised, the problem is not too much budget but something else. There are two aspects you can explore to address the problem:
Budget Inter-Dependencies
In the MCDA implementation of the Juno Cassandra Default Road Network model, the model will not allow a Preservation Surfacing to be applied if there there is already too much structural distress.
If your Resurfacing budget is not being fully utilised while the Pre-Repairs and Rehabilitation budgets are mostly utilised, that is often an indication that you should increase your pre-repair or heavy maintenance budget. By increasing the Pre-Repair budget, you allow more heavy asphalt maintenance and pre-seal repairs to be done, thereby allowing more Holding Seals to be placed. You can also explore other variations of increasing one budget by holding other budgets the same to see if this addresses the under-utilisation problem.
Candidate Selection Thresholds
Another reason for under utilisation of available budget may be that your Candidate Selection thresholds are too strict. In the Cassandra Default Road Network Model, the Candidate Selection thresholds are used to filter out segments for which a treatment is definitely not needed, thereby ensuring that the downstream optimisation algorithm does not have to do unneccessary work.
Although the default thresholds for Candidate Selection are already quite generous, you may want to tweak these thresholds to see if they have any influence on budget utilisation. See this page for details on which lookup set to modify.
Treatment Suitability Scores
The role of Treatment Suitability Scores was already discussed above.If the TSS is below a certain threshold (specified in the model configuration), then that treatment will not be considered during optimisation. Thus, you can explore adjusting thresholds for the TSS and other thresholds related to the MCDA model to see whether these influence budget utilisation.
See this page for details on the parameters that influence the TSS specifically. See this page for details on thresholds that influence the triggering of treatments in an MCDA model.
Addressing Network Condition
Once your model fully utilises the available budget at the current or reduced level, you can begin to explore how to improve network condition by relaxing budget constraints in one or more budget categories.
This process can be confusing and frustrating, but we have found that the following steps can help bring structure and consistency to this complex process:
Step 1: Check Treatment Quantities Under Current Budget
Start by checking the treatment quantities in each treatment category. You can work either with Treatment Categories (more engineering based) or Budget Categories (more financial). See this page for more information on the difference between Treatment and Budget Categories.
We recommend you “% of Network Length Treated” in each treatment or budget categories. If you are happy to work with Treatment Categories, you can use the built-in tool in Cassandra Desktop that allows you to quickly check these percentages. Go to Post-Processing and select Treatment Quantities. Ensure that you tick the boxes ‘Report in terms of Treatment CATEGORIES’ and ‘Express values as a percentage of Total Quantity’. Make sure you select ‘file_length’ (input column holding segment length) as the Quantity Column.
Knowing what percentage of the network can be treated under the low or current budget scenario gives you a baseline to work from. In our experience, for New Zealand Local Authority networks, typical values for Resurfacing are 4% to 6% of network length per year, and 0.2% to 0.5% per year for Rehabilitation. It is important that you ensure the full budget is being utilised at these levels. Check this before you proceed to the next step.
Step 2: Explore Increased Budget Scenarios
Once you have an idea of the levels of treatment being achieved at the low or current budget levels, you can start exploring the influence of increased or decreased funding. Unless your future network condition stays near constant or improves under the current budget scenario, you will almost certainly want to explore the effects of increased budgets.
A recommended starting point is to discuss with your client typical target levels for Resurfacing and Rehabilitation. Recent experience with New Zealand Local Authorities showed that clients often want to explore what long term network condition would look like under scenarios that allow 6% to 8% Resurfacing and 0.5% to 1% Rehabilitation per year.
Knowing typical rates for Resurfacing and Rehabilitation, you can do a rough first estimate calculation of the required budgets for each category to meet your targets. Then you can do some iterative model runs to get the required treatment levels. With the MCDA model, Juno Cassandra runs quite fast, so even doing many iterations will not take too much time.
A crucial element, however, is to have the tools or scripts ready to check the outputs after each iteration. You can use the built in tools in Juno Cassandra such as the Treatment Quantity breakdown and the Budget Utilisation tool under the Post-Processing menu to check key metrics after each run.
However, as you become a more skilled and experienced modeller, you should look into developing your own set of post-processing tools to expedite the analysis of model outputs and get metrics that you find most useful.
For example, at Juno Services, we use a suite of R-scripts that we run in R-Studio after each model run (Cassandra makes a sound to let us know when a run is done). Each time a run is complete, we press Shift-Ctrl-Enter and within a few seconds we get a full set of tables and graphs that tell us everything we want to know about that model run. This includes:
Report-ready tables showing % of network treated in each Treatment/Budget category.
Forensic tables showing budget utilisation, numbers of segments not treated etc.
Report-ready graphs showing predicted network condition under one or more budget scenarios.